How to Track KPIs of Your Google Web Stories: Step by Step Guide
There are a few methods to track the performance of your Google Web Stories. Here is a tutorial on how to analyze data in the Google Search Console and Universal Google Analytics.
Over the last few months, I’ve noticed a shift in data regarding Web Stories. Spoiler: It’s great news for content creators!
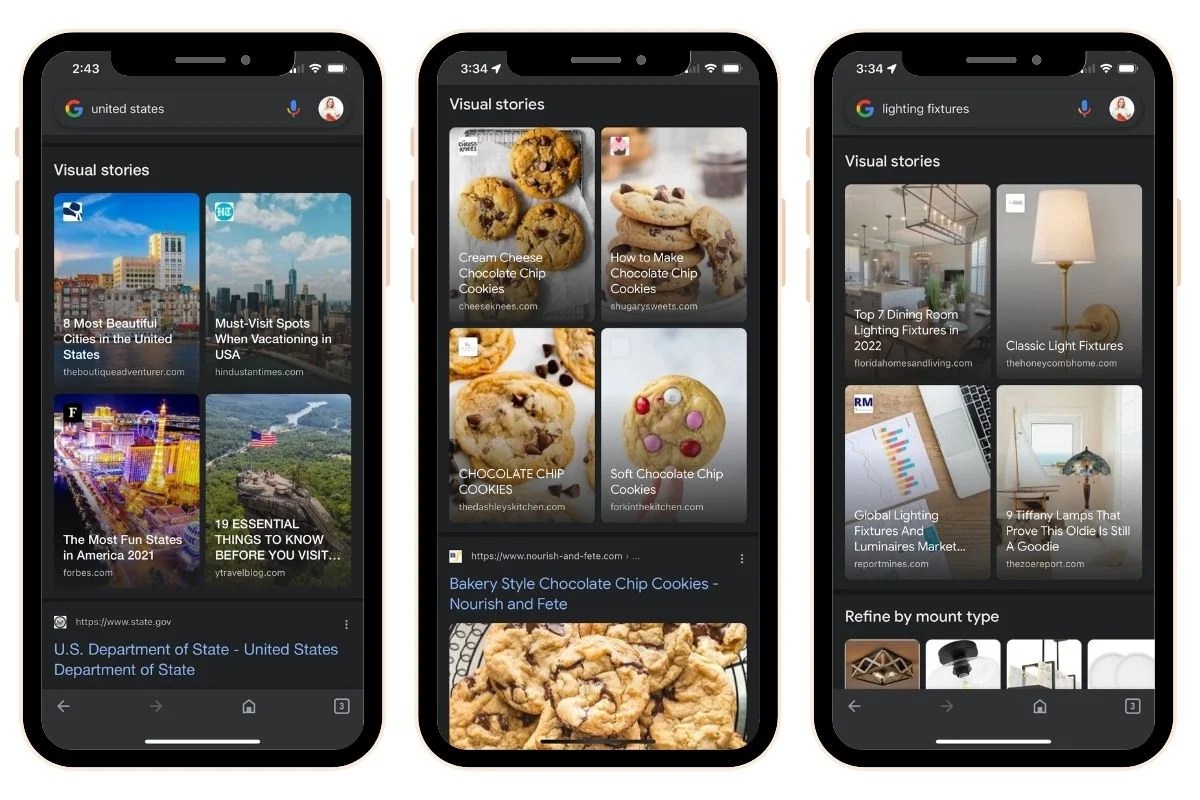
If you use the Discover app to make searches, there is a new section that’s labeled “Visual stories”. That means that there is even greater potential to bring new visitors to your blog. Web Stories are an easy opportunity to repurpose your best blog posts and give your website more visibility on Google.
While you’re here, make sure you check out my tutorial on How to Create Google Web Stories and check out these Web Stories Examples for Beginners.
What are KPIs?
KPI stands for “Key Performance Indicator”. Tracking KPIs for your Web Stories will tell you how many impressions your stories have, how many people are clicking on the stories to view them, and how many people actually click through to your website because of your stories.
How to Set Up KPIs for Google Web Stories
In my opinion, the easiest way to track how many people are heading to your website through your Web Stories is by setting up UTM tracking codes.
The UTM code is something that you can add to the end of the URL on your blog that you want users to click on within your Web Stories. There is no right or wrong way to label the parameters within your tracking codes.
Here is an example of how you could potentially set up the landing page URL:
https://floridahomesandliving.com/pros-cons-living-in-orlando/?utm_source=google&utm_medium=Web_Stories&utm_campaign=Web_StoriesI’ve also embedded a web story that I created and published for a client. You can open it in a new tab and see how I structured each slide to include a landing page URL with a tracking code.
How to Find Data for Google Web Stories
So there are a few ways to track the performance of your Web Stories. I’m going to show you how they are appearing in search results first.
Google Search Console
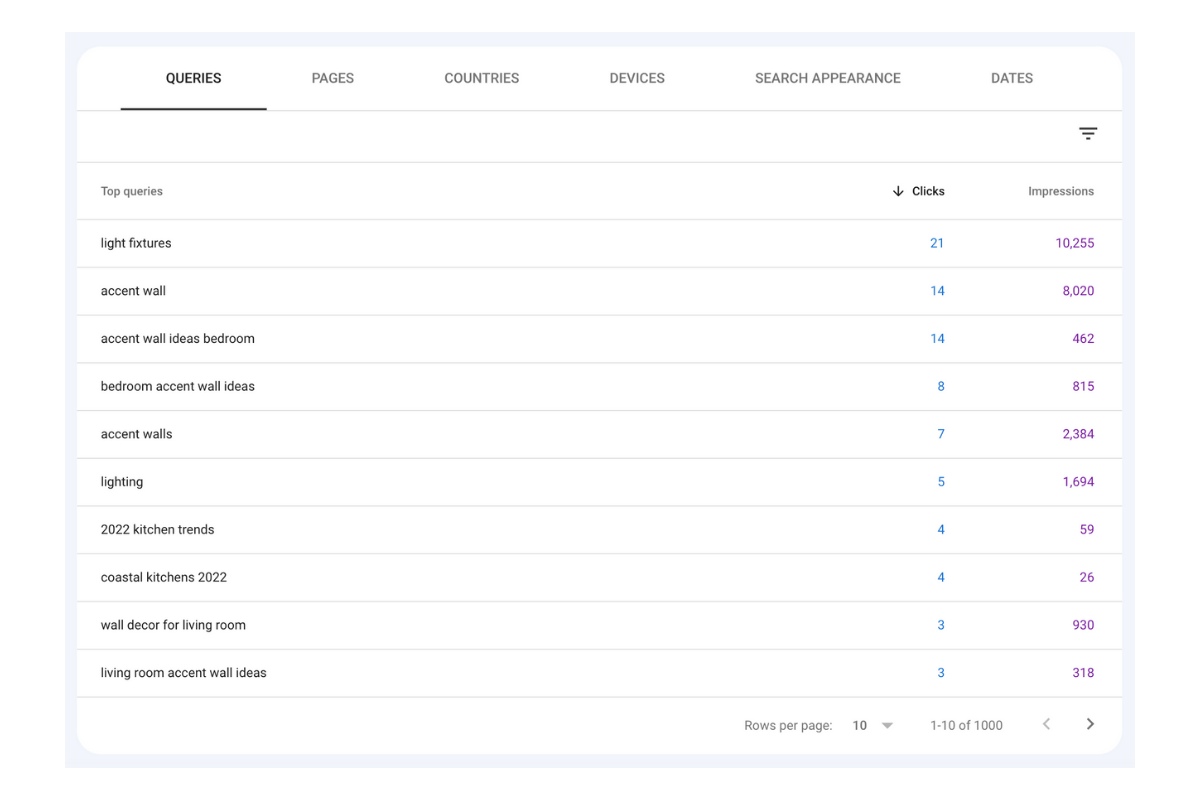
If you want to see how your Web Stories are performing in search results, head to your Google Search Console account.
Under Performance, click on Search results. Then above the graphic, select the New button and click on Page. Select “URLs containing” and type in web-stories.
Watch the video below for a visual step-by-step process.
This data will show you how Web Stories are populating in search results (this is separate from the Discover results, which are based on a user’s activity and interests).

Universal Google Analytics
If you have the UTM codes set up within your Web Stories, then there is a quick way within Google Analytics that will show you how many new users are visiting your website as a result.
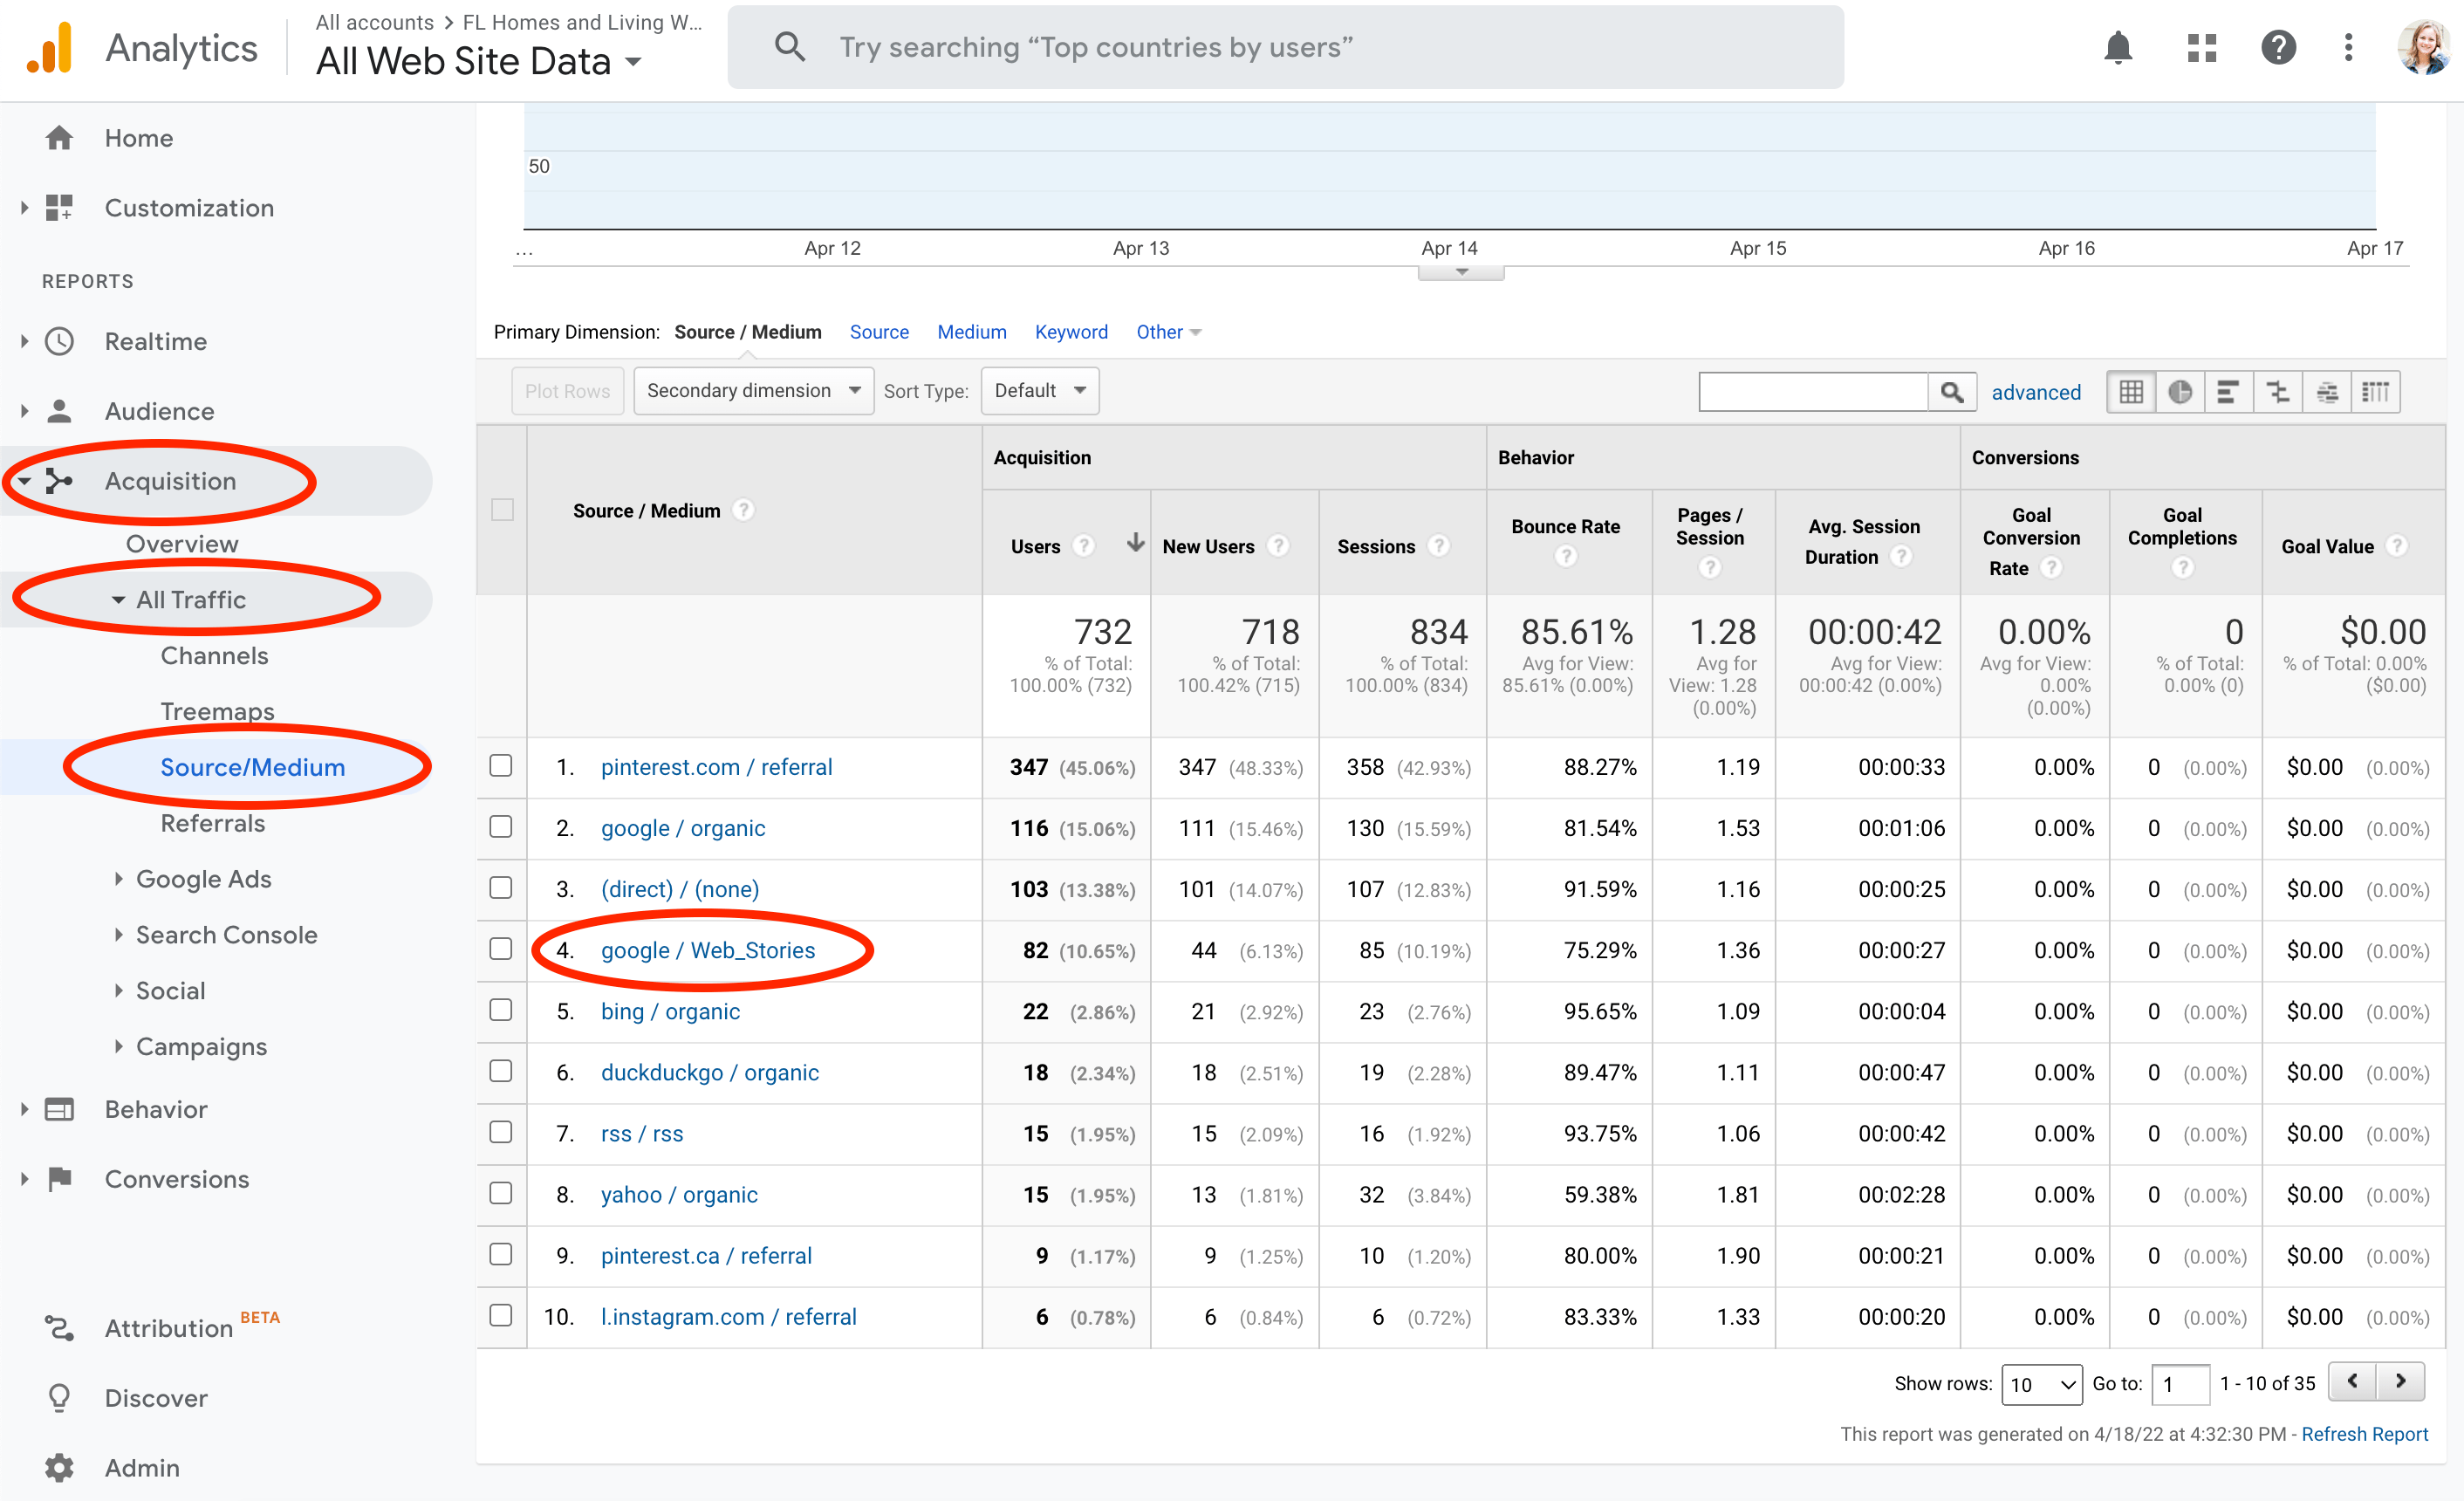
Head to your Google Analytics account. Then you’ll click on Acquisition -> All Traffic -> Source/Medium. In the screenshot below, you can see the list of sources that are populated. This will look different for every website, but it typically includes all of your social media referrals.
This blog is relatively small (less than 70 blog posts), and we have only published 12 Web Stories so far. So, it’s very telling that Web Stories are now almost 11% of all referral traffic!
If you’re interested in working with me, you can learn more about hiring me to create Google Web Stories for your blog.